 Member Benefits
 How to Join
 En Espanol
Outside of a crisis or recession, Americans’ perceptions of how the country and economy are being managed have never been so negative. Many have attributed this voter unhappiness to a crisis of “affordability.”
It is objectively true that it is too hard for most American families to afford a secure and dignified life. But the word “affordability” leads too many people—including policymakers—to fixate on prices. Affordability is not just about prices; instead, it’s the outcome of a race between incomes and prices.
This is not just economists quibbling. Focusing on prices will lead policymakers to ignore far too much of the useful playing field when thinking about what changes could make life better for working families.
In this article, we make the following arguments:
- Far too many families are unable to afford a decent economic life.
- The primary cause is a large increase in income and wage inequality, with incomes and wages for the vast majority of families lagging far behind what they could and should be.
- This rise in inequality was caused by increasingly unequal “market” incomes (e.g., wages and salaries, returns on investments), while changes in taxes or transfers (e.g., Social Security, Medicare, unemployment insurance) slightly dampened the rise of income inequality.
- The large rise in income inequality was driven by intentional policy changes that affected typical workers’ leverage and bargaining power in the labor market—and that means they can be reversed.
- In capitalist economies (like ours), labor markets are inherently tilted toward employers—but historically and globally, broadly shared prosperity has only been achieved when policies that intentionally support workers (like strong unions, adequate minimum wages, and full employment mandates) have provided a countervailing force against employers’ power in labor markets.
- Much of the post-1979 period in the United States saw an assault on worker-friendly policies, and this led directly to the rise in inequality and to weak income growth for working families.
Americans’ Economic Dissatisfaction Has Real Roots
The US economy is the richest in the world, yet the gap between what it could deliver to working families versus what it actually delivers is maddening. This gap can be measured with some precision. Figure A shows inflation-adjusted household income for the middle-fifth of US families between 1979 and 2022, as well as what this growth could have been had it simply grown as fast as average incomes did in this period.
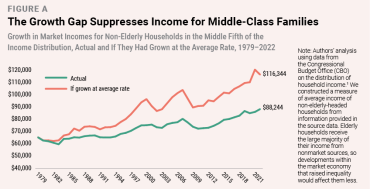
This gap is driven by inequality. Average incomes can only rise faster than incomes at the middle if some groups—the ultra-rich in this case—see strongly above-average growth. This gap between average growth and growth experienced by the middle reached staggering levels by 2022 (the most recent data from the Congressional Budget Office). In that year, inequality’s rise since 1979 deprived middle-income families of an average of $28,100. Life for these families would be far more affordable today if they had this money coming in each year. And that’s well within our grasp. Average income growth is by definition attainable. All that’s needed are policies that ensure income growth is broadly shared, instead of policies that cause staggeringly fast income growth among the top 1 percent and much slower income growth for working people.
Figure B shows this inequality another way—charting average annual growth rates for the 1979–2022 period for a number of groups ranked by their position in the income distribution. The strikingly bad news from this figure is that only household groups above the 90th percentile saw income growth that matched or exceeded average income growth. How can more than 90 percent of households be below average when it comes to income growth? This is possible because the top 5 percent—and especially the top 1 percent—saw astoundingly fast growth over this period.
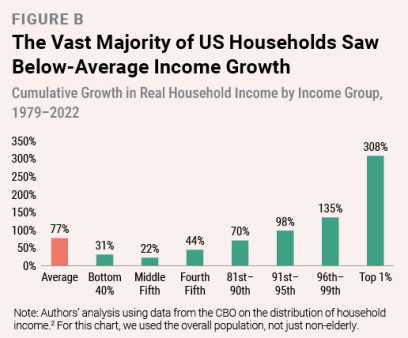
For any given average growth rate, faster growth at the top of the scale must be matched by slower growth at the middle and/or bottom. It is this zero-sum dynamic of inequality, not anything to do with prices, that has been the crushing drag on regular Americans trying to afford a better life over time.
Staggering Inequality Is a Choice
This growth in inequality has been driven by the rules governing markets—rules our elected leaders determine—not by taxes or transfers. Figure A showed the staggering $28,100 gap in market (pre-tax and transfer) income between what families in the middle-fifth actually made in 2022 versus what they could have made had inequality not risen. Figure C shows how large this gap is after the federal government gets involved on the tax and transfer side of the equation.
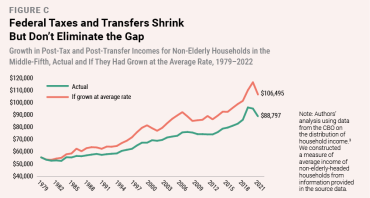
Taxes obviously reduce incomes, but transfers (social insurance like Social Security and income support payments like unemployment insurance) raise incomes. For the middle-fifth of US households, this effect is largely a wash—their current income levels in Figures A and C are very similar. But because the United States still has a progressive federal tax system (though not as progressive as we would like), the rise of inequality in this post-tax and transfer data is slightly muted—i.e., federal taxes and transfers shrink the gap somewhat. By 2022, the annual gap after accounting for federal taxes and transfers is $17,698—still a sum of money that would be transformative for American families.
Essentially, federal taxes and transfers undid roughly one-third of the rise in income inequality, allowing rich households to pocket roughly two-thirds of their gains.*
This rise in inequality was overwhelmingly driven by an intentional, multipronged policy campaign to suppress wages that was undertaken by shareholders, other capital owners, and corporate executives, with policymakers greasing the skids along the way.4 The primacy of wage suppression can be seen in Figure D, which compares the economy’s potential to pay higher wages and incomes with the actual hourly pay of typical workers in the United States.
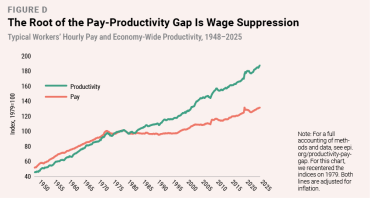
We measure the economy’s potential to pay higher wages by productivity, which is the output and income generated in the economy in an hour of work on average. And we define typical workers’ pay as the wages and benefits of workers in production and nonsupervisory positions, a group that constitutes over 80 percent of the economy’s private-sector workforce, excluding higher-wage managers and executives. As you see in the figure, in the three decades after World War II, productivity and pay mostly moved roughly in tandem, with typical workers’ pay rising 83 percent as fast as productivity. After 1979, these lines diverge sharply, with workers’ pay rising only about 43 percent as fast as productivity.
If typical workers’ pay had risen in line with productivity growth in the years since 1979, their hourly pay would be 43 percent higher today. For a full-time, full-year worker making the median wage, this would constitute annual wages that are almost $23,000 higher.5 Where did that $23,000 go? Instead of paying workers more as their productivity rose, corporate executives, other already highly paid professionals, and shareholders captured those gains for themselves.
This growing gap between what shows up in typical workers’ paychecks and benefits versus the overall income being generated in the economy is the root story of American inequality and of today’s affordability crisis.
This pay-productivity gap can be decomposed into two parts: the portion driven by rising inequality in “labor” income (income earned from work), and the portion driven by a shift from labor income to “capital” income (income from investments, like when a stock increases in value). Growing inequality within labor incomes—earnings growing much faster among high-paying jobs than among middle- and low-paying jobs—accounts for almost 80 percent of the gap. The remaining 20 percent is accounted for by a shift from labor income to capital income.6 Below we say a bit more about each of these.
Rising Inequality of Labor Incomes
The larger factor in the rise of overall income inequality is the growing inequality within labor incomes. This often surprises people, who assume the story of rising inequality is mostly one of the profits of rich corporations rising while most of their workers are left behind. It’s true that most workers in these corporations do not benefit, but the powerful employees who do prosper—CEOs and other executives—receive astronomical salaries that are classified as labor income in economic data, and these inflated executive salaries do cut into corporate profits.
In addition, below the stratospheric level of corporate managers at large companies, there is a stratum of workers in medicine, legal services, and finance who command huge salaries. It’s not a large group of people, but the rise in their pay has been extreme. Figure E highlights this radical inequality within labor incomes, showing annual earnings of various wage groupings. (To keep the figure legible, pre-1979 data are not shown.) Prior to 1979, wage growth among very high wage workers—those in the top 10 percent, the top 1 percent, and the top 0.1 percent—was roughly in line with wage growth for the vast majority (i.e., for the bottom 90 percent). But between 1979 and 2023, cumulative growth in average annual earnings for the bottom 90 percent of workers was 44 percent, compared with 133 percent for the top 1 percent. For the top 0.1 percent, this growth was 354 percent—so high it doesn’t fit in the figure.
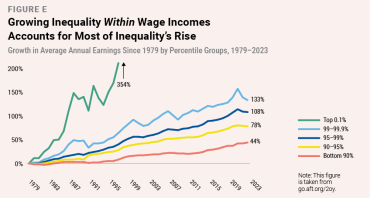
Given that labor income remains the large majority of all income generated in the economy, this huge rise in inequality within labor incomes is a key driver of the economy-wide march to greater inequality. Workers at the top of the wage scale were largely able to insulate themselves from the campaign of wage suppression launched by corporate owners. Of course, some of them were active participants in this campaign and got a significant cut of its benefits (think CEOs and lawyers for union-busting law firms). But the vast majority of workers (roughly 90 percent, as we see in Figure B) were on the losing side of this wage suppression campaign and found their wages falling far behind the economy’s potential to deliver strong and sustained wage growth.
In some ways, the influence of rising inequality within labor incomes might be underestimated. For decades, US tax policy has levied lower tax rates on capital income than labor income, and a great deal of capital gains escapes taxation entirely due to loopholes.
Many of the same people who have been privileged enough to insulate themselves from wage suppression are also privileged enough to have excellent accountants who can make their incomes appear in whatever form results in the lowest taxes.7 For example, CEOs are overwhelmingly paid with “performance-based” measures, which means measures tied to the value of their companies’ stock prices. Twenty years ago, the large majority of this stock-based pay for CEOs came in the form of stock options, which are contracts that give the CEO the right (but not the obligation) to buy shares of stock at a set price. If the market price went above this set price, CEOs could exercise these options and pocket the difference as pay. The gains from exercised stock options are recognized by the IRS as labor income, taxed accordingly, and classified in data as labor income. But over the past two decades, there has been a pronounced shift in the stock-based pay of CEOs away from stock options and toward the outright granting of stock. In this case, CEOs are not given a right to buy shares at a preferential price; they are simply given shares.8 What’s important for the split between capital and labor incomes is that these non-option forms of stock-based compensation are far less likely to be captured in measures of wage incomes. So this tax evasion strategy artificially depresses estimates of labor income in the economy.
The Shift from Labor to Capital Incomes
While most of the pay-productivity gap stemmed from the rising inequality within labor earnings discussed above, a nontrivial portion of this gap stemmed from a shift in overall income from labor to capital. This goes far beyond the tax avoidance trick described above for CEO compensation—including paying regular working people less so that shareholders get more. If, for example, a corporation were able to suppress its workers’ pay while raising customers’ prices and/or cutting what it paid suppliers (which generally means those suppliers paying their workers less), it would earn higher profits. By successfully suppressing wages to boost profits, American corporations have made their stock more valuable. Imagine an investor buys $100 in company stock with the expectation of an annual return of $5. If the company undertakes a successful campaign of wage suppression that boosts annual returns to $10, many other investors will buy company stock—bidding up share prices.
So even though this labor-to-capital shift in overall income is the smaller player in generating overall income inequality, it still had profound effects on American economic life. Estimates indicate that anywhere from 40 percent to nearly 100 percent of the entire nominal gains in the US stock market since 1989 can be attributed to this shift of income from workers to capital owners.9
The rise in US stock prices in recent decades is a key driver of another kind of economic inequality: inequality of wealth.† One of the primary sources of wealth, the ownership of corporate equities (e.g., shares of stocks), is incredibly concentrated; the top 10 percent of households own about 85 percent of all corporate equities, and the top 1 percent own nearly 40 percent.10
The concentration of corporate equities combined with the role of wage suppression in making these equities far more valuable leads to a clear implication: The wage suppression of recent decades is not just by far the biggest driver of the rise in income inequality; it is also by far the biggest driver of the rise in wealth inequality. Most of the rise in wealth inequality in recent decades has been the outcome of an intentional transfer away from workers to the top.

Labor Markets Are Not Fair
This rise in inequality in recent decades has attracted much attention from researchers—along with everybody else struggling to pay for groceries and keep the lights on. For a long time, economists’ role in the debate over inequality was to look for reasons why well-functioning, competitive markets could generate lots of inequality. This often led to explanations that essentially blamed workers for the outcomes. The argument was that the fair and competitive labor market had spoken and that these workers were falling behind because their skills and efforts had been found wanting. The precise failure identified was often workers’ alleged inability to adapt to the quickening pace of technological change in the economy.
But the evidence supporting this view of inequality driven by apolitical forces working through fair and competitive markets was incredibly thin.11 That led many researchers to examine whether labor markets are by their very nature tilted against workers, making it very difficult to secure regular raises that match overall economic growth.
There is ample evidence for this view—that excess employer-side power makes labor markets generally unfair and inefficient, and that truly fair, competitive labor markets are the exception, not the rule. For example, many employers, and particularly those of low- and moderate-wage workers, rarely if ever negotiate pay; instead, they post take-it-or-leave-it wage offers.12 And when a given employer lets its wages lag behind those of potential competitors, workers’ exit from the lower-wage firm is far less common than would be predicted under truly competitive labor markets (where employers robustly compete for workers).13
This employer-side power is rooted in many obvious factors in real-world labor markets that make it hard for workers to effectively search for better jobs and, therefore, force employers to compete over them. These include things like lack of information about wages and benefits offered by other employers, transportation restrictions that require workers to look for jobs only in places near their homes or public transit nodes, and childcare considerations that require a job’s location be compatible with picking up kids at a regular time, along with many other factors.
Another barrier to competition is the obvious fact that in the short run, most employers need the income a new worker would generate for their business far less than most workers need the income from a job. In a jobsite of 100 workers, having a month go by understaffed by a single worker reduces business income by roughly 1 percent. In a household with a single worker, having a month go by without a job reduces income by essentially 100 percent.
Employers exploit these barriers to employees finding better options by “marking down” wages below what would be necessary for employers to attract and retain workers in competitive labor markets. These markdowns can be large enough to push workers’ pay well below the value they produce for the employer (i.e., below the “market clearing” wage). This makes them not just unfair, but inefficient—a drag on economic growth.
Key Policy Choices That Led to Rising Inequality
Having realized the role of employers’ power in determining labor market outcomes, the importance of specific policies is magnified. For example, before the 1990s, many economists were extremely skeptical that minimum wages could do much good in raising wages without steep downsides like job loss. Why? Because they erroneously used models of competitive labor markets.
But more accurate models that include employers’ power reveal significant room to raise minimum wages without generating job losses. The evidence over the past 30 years has been highly persuasive that minimum wages could be much higher than they were in the 1980s and 1990s without causing job losses and that the benefits for low-wage workers would be large.14
The period of rising inequality since 1979 was one of profound institutional change in labor markets. The federal minimum wage, for example, lost 35 percent of its value between 1979 and 2025 as legislative inaction (i.e., not raising it) allowed it to be battered into irrelevance by inflation.15 This was also a period that saw a pronounced acceleration in the decline of unionization rates of American workers.16 It was a time when high levels of unemployment were tolerated by policymakers for extended periods in the name of fighting inflation.17 And it was a time when increasing integration between the rich United States and a poorer global economy was done on terms that were written by and for corporate interests.‡
Several years ago, researchers at our organization, the Economic Policy Institute, reviewed the research on how much specific policy choices likely contributed to growing inequality. Adding together the impacts of the changes like those listed above could easily explain the lion’s share of the rise in inequality since 1979.18
For example, one key policy change was the practical abandonment of the Federal Reserve’s full employment mandate. By law, the Fed is supposed to pursue both stable inflation and full employment (which means trying to keep unemployment as low as is consistent with stable inflation). But between 1979 and 2007 (right before the Great Recession), the Fed largely acted as if it did have a mandate to pursue stable inflation but did not have one to pursue full employment.
After the Great Recession, the Fed admirably reversed course and tried to push the economy back to full employment, but its tools proved too weak given the magnitude of the shock. In such situations, fiscal policy—taxes and spending—should be used aggressively to restore full employment. But in the 2010s, political gridlock and excess caution kept policymakers from doing this, and much of that decade was plagued by excess unemployment.
Excess unemployment does not just leave willing workers locked out of jobs. It also saps the ability of still-employed workers to demand raises. For nonunion workers, their chief leverage for getting wage increases is threatening to quit. This threat is only credible when unemployment is low. Consequently, the too-high unemployment rates for most of the period from 1979 to 2019 were a drag on wage growth. In our estimates, too-high unemployment may well have explained nearly a third of the entire pay-productivity gap over that period19—not to mention the devastation it wrought for millions of families.
Another key policy change was the failure to keep the playing field level between workers looking to organize and join unions and the employers who wanted to stop them. The National Labor Relations Board is supposed to safeguard this right, but its tools have proved too weak in the face of fierce employer opposition to unions, and policy changes to strengthen these tools have consistently been blocked. The results of throttling the growth of new unions have been profound; our estimates are that declining unionization likely explains a quarter of the pay-productivity gap since 1979.20 Crucially, the decline in unionization did not just hurt workers who otherwise would have been unionized. By far the biggest of the wage-suppressing effects of deunionization has been on the broad pool of nonunion workers. As unions lose strength, they stop being able to set industry-wide pay standards that even nonunion employers feel like they have to meet to avoid hemorrhaging employees.
The wage-depressing effect of trade flows from poorer nations—flows encouraged by the corporate-led trade agreements the United States has signed in recent decades—can likely explain another 10 to 15 percent of the pay-productivity divergence since 1979.21
The Wrong Incentives
Tolerating excess unemployment, throttling workers’ ability to join unions, failing to update the minimum wage as costs rise, and signing corporate-friendly trade agreements were some of the many instruments of wage suppression undertaken and abetted by policymakers in recent decades. At the same time, choices legislators made on tax policy boosted the incentive for capital owners and corporate managers to aggressively use these instruments to increase their wealth.
When ultra-high incomes and corporate profits are taxed at high (i.e., appropriate) rates, the incentives for powerful individuals to rig the rules of markets to suppress regular workers’ wages are much smaller. Key research shows that this incentive effect is real and powerful. For example, across countries, the larger the tax cuts on the rich enacted in recent decades, the greater the increase in pre-tax inequality.22 And, the lower the top tax rates for individuals, the higher the levels of pre-tax CEO pay.23 High taxes reduce the benefits of rule-rigging, so cutting taxes increases rule-rigging. This means that raising taxes on the richest households and corporations results in new revenue and more equal pre-tax incomes. But from the mid-1970s, tax rates for high-income households and corporations have been cut steadily and deeply in the United States, reducing both tax revenues and wages for working people.
Income Inequality, Not High Prices, Is Behind the Affordability Crisis
We opened this article with a claim that affordability is the outcome of a race between income and prices. Our long walk through the economics and history of recent American inequality highlights that intentional policy choices have deprived typical households of income they could have otherwise claimed. Without this inequality, a middle-income household today would have tens of thousands of dollars more per year—and this would obviously make affording a decent life much easier.
But some might wonder if we have still given prices short shrift in how much they contribute to affordability challenges. We don’t think so, for a number of reasons. We sketch three of them here.
First, all of the income, wage, and productivity statistics we have included in this article have been real (i.e., they have been adjusted for the impact of inflation). And it is unambiguously true that real (inflation-adjusted) incomes are the proper way to measure living standards and economic possibilities for households.
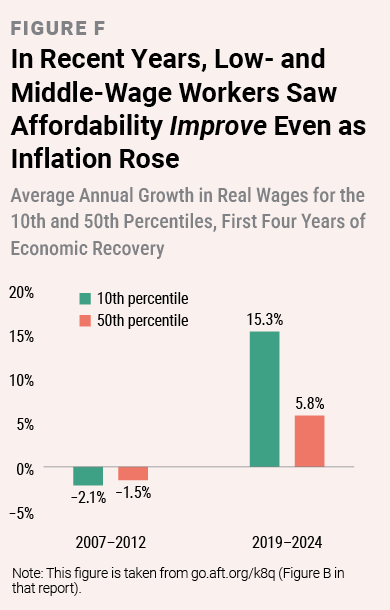
Getting distracted by price growth while missing what’s happening with income will lead to wrong conclusions about economic performance over even relatively recent periods of time. Figure F compares two periods, both starting one year before a deep recession struck and then running five years: 2007–2012 and 2019–2024. In the first period, inflation averaged 1.8 percent, while in the second it ran more than twice as fast at 4.2 percent. Yet real (inflation-adjusted) wage growth for low- and middle-wage workers was far faster in the second period. For the lowest-wage workers, real wages fell by 2.1 percent in the first period but rose by 15.3 percent in the second. For workers in the middle of the wage scale, real wages fell by 1.5 percent in the first period but rose by 5.8 percent in the second.
Over very short periods of time (one to two years), it is true that a rapid spike in prices tends to drive down real incomes and wages. But over any longer period (even as short as three to five years), assessing how the economy is doing for typical families rarely bears much relationship to price growth.
Second, even when researchers adjust for inflation differently at different parts of the wage and income distribution, the impact is modest. Such measures account for things like lower-income families spending a higher share of their income on rent and groceries and a lower share on vacations. But there are surprisingly small differences in overall price growth faced by families at different income levels. For example, from 2019 to 2025, when the price of housing and groceries was on peoples’ minds for good reasons, the inflation rate faced by the bottom 40 percent of households was just 0.2 percent higher than for the top 20 percent of households.24 In short, the growth in prices faced by different groups varies far less than the growth of their incomes and wages.
Third, a key insight in assessing affordability debates is that one person’s cost is another person’s income. If the cost of a pound of coffee doubles from $10 to $20, this constitutes $10 of additional income that somebody is getting. Perhaps the coffee grower or the shipper or the grocery store shareholders or the CEO or the cashiers or some other link in the supply chain is getting an extra $10 (or several of them are getting some slice of it). This means that rapidly rising prices cannot result in less income overall, so they are highly unlikely to actually make an entire economy poorer. Instead, the groups that face only the price increase lose out while groups receiving the extra income win.
This fact that every price is an amalgamation of various income streams also means policymakers can more usefully target wage and income policies rather than price policies. Again, my bill at the grocery store pays for the wages of cashiers, the pay of the company CEO, the dividends to shareholders, the payments to suppliers, and more. Even if we’re unhappy about this grocery bill, we likely don’t want all of those price components to get squeezed. We probably want the wages of cashiers to rise while hoping to rein in CEO pay and shareholder dividends. Policies that only look to restrain prices—price controls, for example—make no such distinction, so we don’t know who in the grocery supply chain will bear their burden (though we can guess it’s more likely to be the cashiers than the CEO). But if we raise minimum wages, change labor law to allow more widespread unionization, and raise taxes on the ultra-rich and on corporate profits, we have a very good idea of which incomes will be boosted and which will get squeezed.

Creating a Fairer Economy
It is deeply depressing that intentional policy acts led to the enormous rise in inequality that is making life so much harder for so many people. If tens of millions of American households had tens of thousands of extra dollars in their bank accounts each year while billionaires had significantly less money, the country would be a much better and happier place.
What brings us hope is the knowledge that because the rise in inequality was not the inevitable outcome of a modern economy, it can be halted and reversed. Today’s workers have the skills and abilities needed to support much higher incomes with no loss in efficiency or employment—if we change policy to give them these higher wages. This is excellent news. Of course, many of today’s elected leaders—and their donors—have little interest in reducing inequality, so the road ahead is long. But the foundational ingredients for a fairer and more efficient economy are clear:
- Keep unemployment rates low for long periods of time and fight recessions fiercely when they inevitably occur.
- Restore the right to organize new unions and bargain collectively.
- Raise minimum wages, including the federal minimum wage.
- Enact rules for the global economy that support healthy wage growth, not just healthy corporate profits.
- Crush the incentive to rig the rules of the economy by raising taxes significantly on ultra-rich households and corporations.
The details on how we create a fairer economy are more complex—and they do matter! But understanding that the affordability crisis facing American families is overwhelmingly an inequality crisis is a necessary and useful place to start.
Heidi Shierholz is the president of the Economic Policy Institute (EPI). Her previous positions include serving as EPI’s policy director, the chief economist at the Department of Labor under the Obama administration, and an assistant professor of economics at the University of Toronto. Josh Bivens is EPI’s chief economist. The author of several books and numerous journal articles, he began his career as an assistant professor of economics at Roosevelt University.
*Since this analysis goes through 2022, it does not include the tax or benefits cuts (including to Medicaid and the Supplemental Nutrition Assistance Program) in the One Big Beautiful Bill Act that President Trump signed into law in July 2025. These will further increase inequality. (return to article)
†Wealth is the value of a person’s assets (e.g., the equity in their home, stocks and bonds in their retirement accounts, or their baseball card collections) minus the value of their debts. (return to article)
‡For details, see “A Trade Policy That Puts Working Families First.” (return to article)
Endnotes
1. Congressional Budget Office, The Distribution of Household Income, 2022 (January 2026), cbo.gov/publication/61911.
2. Congressional Budget Office, The Distribution.
3. Congressional Budget Office, The Distribution.
4. For a much deeper dive into the specifics of this policy campaign of wage suppression, along with empirical assessments of how much it cost American families, see L. Mishel and J. Bivens, “Identifying the Policy Levers Generating Wage Suppression and Wage Inequality,” Economic Policy Institute, May 13, 2021, epi.org/unequalpower/publications/wage-suppression-inequality.
5. The median wage for US workers in 2025 was $25.67. This (and a lot more) can be found at data.epi.org. Multiplying this median wage by 0.43 and then by 2,080 (hours worked by a full-time/full-year worker) yields the $23,000 figure.
6. Earlier estimates of how much inequality within wages contributed to the pay-productivity gap can be found here: L. Mishel, “Growing Inequalities, Reflecting Growing Employer Power, Have Generated a Productivity–Pay Gap Since 1979,” Working Economics Blog, September 2, 2021, epi.org/blog/growing-inequalities-reflecting-growing-employer-power-have-generated-a-productivity-pay-gap-since-1979-productivity-has-grown-3-5-times-as-much-as-pay-for-the-typical-worker. The easy way to update this (which we did for this report) is to compare productivity to growth in overall average compensation of American workers since 1979. This overall average compensation rose by roughly 76 percent since 1979. Given typical workers’ pay growth of just under 30 percent, this means that 46 percent (76 percent minus 30 percent) of the divergence between typical workers’ pay and productivity is a difference between typical workers’ pay and average pay.
7. See here for an estimate of how much of today’s reported capital incomes would be more properly classified as the returns to work (i.e., labor incomes): A. Eisfeldt, A. Falato, and M. Xiaolan, “Human Capitalists,” NBER Working Paper no. 28815, National Bureau of Economic Research, April 2022, nber.org/papers/w28815.
8. For more on CEO pay levels and their composition, see J. Bivens, E. Gould, and J. Kandra, “CEO Pay Has Skyrocketed Since 1978,” Economic Policy Institute, September 25, 2025, epi.org/publication/ceo-pay.
9. For this estimate, see D. Greenwald, M. Lettau, and S. Ludvigson, “How the Wealth Was Won: Factor Shares as Market Fundamentals,” Journal of Political Economy 133, no. 4 (April 2025): 1083–1132; and A. Atkeson, J. Heathcote, and F. Perri, A Macroeconomic Perspective on Stock Market Valuation Ratios (Federal Reserve Bank of Minneapolis, Research Division, January 2026), minneapolisfed.org/research/sr/sr682.pdf.
10. See Table 10 in: E. Wolff, “Household Wealth Trends in the United States, 1962 to 2019: Median Wealth Rebounds… but Not Enough,” NBER Working Paper no. 28383, National Bureau of Economic Research, January 2021, nber.org/system/files/working_papers/w28383/w28383.pdf.
11. For a much deeper dive into the weakness of claims that inequality was driven by technology rewarding skilled workers and penalizing less-skilled workers, see J. Schmitt, H. Shierholz, and L. Mishel, Don’t Blame the Robots: Assessing the Job Polarization Explanation of Growing Wage Inequality (Economic Policy Institute, November 19, 2013), epi.org/publication/technology-inequality-dont-blame-the-robots.
12. One study found that roughly 75 percent of low-wage jobs were ones where employers made take-it-or-leave-it posted offers: R. Hall and A. Krueger, “Evidence on the Incidence of Wage Posting, Wage Bargaining, and On-the-Job Search,” American Economic Journal: Macroeconomics 4, no. 4 (October 2012): 56–67; and R. Hall and A. Krueger, “Evidence on the Determinants of the Choice Between Wage Posting and Wage Bargaining,” NBER Working Paper no. 16033, National Bureau of Economic Research, May 2010, nber.org/system/files/working_papers/w16033/w16033.pdf.
13. For evidence on how nonresponsive worker quits are to wage cuts relative to predictions of competitive markets, see A. Dube, L. Giuliano, and J. Leonard, “Fairness and Frictions: The Impact of Unequal Raises on Quit Behavior,” American Economic Review 109, no. 2 (February 2019): 620–63.
14. For a comprehensive review of this evidence, see D. Cengiz et al., “The Effect of Minimum Wages on Low-Wage Jobs,” Quarterly Journal of Economics 134, no. 3 (August 2019): 1405–54.
15. Economic Policy Institute, “Minimum Wages: Real Minimum Wage (2025$),” 2026, data.epi.org/minimum_wage/minimum_wage_levels/line/year/national/real_minimum_wage_2025/overall?timeStart=1938-01-01&timeEnd=2025-01-01&dateString=1979-01-01&highlightedLines=overall.
16. P. Romero and J. Whittaker, A Brief Examination of Union Membership Data (Library of Congress, June 16, 2023), congress.gov/crs-product/R47596; and H. Meyerson, “Economic Inequality Is Undermining America: Worker Solidarity Will Build a Better Future,” AFT Health Care 3, no. 2 (Fall 2022): 33–36.
17. S. Galan, “Monthly Federal Funds Effective Rate, Unemployment Rate and Inflation Rate in the U.S. During Paul Volcker’s Terms as Federal Reserve Chairperson from 1979 to 1987,” Statista, October 2022, statista.com/statistics/1338105/volcker-shock-interest-rates-unemployment-inflation/?srsltid=AfmBOoqoXQ4yTpqiSJMevwNFbnNGEETrwhlltEeVrJuA1rThyYCBBkFl.
18. Mishel and Bivens, “Identifying the Policy Levers.”
19. J. Bivens, “Focus on the Boom, Not the Slump—the Fed’s New Policy Framework Needs to Stop Cutting Recoveries Short,” Working Economics Blog, Economic Policy Institute, June 18, 2019, epi.org/blog/focus-on-the-boom-not-the-slump-the-feds-new-policy-framework-needs-to-stop-cutting-recoveries-short-epi-macroeconomics-newsletter.
20. Mishel and Bivens, “Identifying the Policy Levers.”
21. Mishel and Bivens, “Identifying the Policy Levers.”
22. A. Fieldhouse, Rising Income Inequality and the Role of Shifting Market-Income Distribution, Tax Burdens, and Tax Rates (Economic Policy Institute, June 14, 2013), epi.org/publication/rising-income-inequality-role-shifting-market.
23. J. Bivens, “Using Tax Policy to Restrain CEO Pay: Best Practices and Smart Alternatives,” Economic Policy Institute, December 13, 2023, epi.org/publication/using-tax-policy-to-restrain-ceo-pay-best-practices-and-smart-alternatives.
24. Authors’ analysis of data obtained from: Federal Reserve Bank of New York, “Economic Heterogeneity Indicators (EHIs),” 2026, newyorkfed.org/research/economic-heterogeneity-indicators.
[Illustrations by Pong]