 Member Benefits
 How to Join
 En Espanol

“My four-year-old son has a cleft lip and palate, and the care he needs isn’t available where we live in southeast Alaska. We’ve had to travel to Seattle for specialist visits and two surgeries; in addition to the hundreds of dollars we pay in coinsurance, the travel expenses add up to about $2,000 for each trip. It can take months to get insurance reimbursement—in the meantime, some of that cost is sitting on my credit card, accruing interest. I’ll have to set aside money for the deductible and travel costs for my son’s future surgeries. That’s money I can’t spend on other necessities or save for emergencies.”
–Caitlin, an AFT member in Alaska
Rising costs are hard to miss. Prices of all manner of goods, from smaller items like raspberries1 to bigger ones like cars,2 keep going up.3 Even worse, wage growth has not kept up,4 so rising prices present a financial challenge to more people. Any gap between costs and income means choosing not to buy something or finding a way to pay for it. If the something is a necessity, like medicine or food, then borrowing (either from oneself by dipping into savings or, in the absence of another option, from a lender) is also a necessity. Because many people lack the financial resources to manage an unexpected expense,5 borrowing—taking on debt—is the only coping mechanism available.
Access to credit is magical. In today’s economy, we can use credit to purchase almost anything; with many purchases, we’re likely to receive an offer for a “buy now, pay later” service. Some of the biggest purchases that people make—to acquire a car, house, or education—typically entail borrowing, and some of the biggest costs we face—to pay for healthcare—may even force it. So for many people, the availability of loans matters greatly to quality of life.
But borrowing comes at a cost: Taking out a loan means taking on the obligation to repay the principal amount plus interest. That obligation comes out of future earnings, which means a smaller amount of disposable income and potentially more financial fragility.
When debt is taken on for something truly nonessential, like a vacation upgrade or designer sneakers, well, that may represent a choice; buyer beware. But when debt results from buying food, medicine, education, or another life essential, we should stop and wonder why. And we should ask whether we have alternatives.
This article examines some of the ways that debt harms people, with particular attention to the challenges of paying for higher education (which I have been writing about for almost 20 years) and healthcare. I make two critical arguments. First, the failure of wage increases to keep pace with rising prices forces more people to take on debt to help pay for essential goods and services that, in more generous nations, the government provides. Second, reliance on credit to enable such purchases works to maintain socioeconomic inequality. This is in part because the burden of repayment only falls on those who need to borrow. It is also because even for those for whom debt pays off, the benefit is reduced by the obligation to repay, and because some people who could take advantage of credit to pay for education or healthcare will not do so because they fear debt. This is a tragic flaw in US policy design: The behavior that providing credit is supposed to enable and encourage is simultaneously punished and discouraged. Laws and policies pursued under the second Trump administration and by the Republican majority in Congress have exacerbated this basic problem by reducing public financial support of those who need it most.
The discussion that follows has four parts. The first part describes the ways in which debt, when used to pay for essential goods and services, heightens the risk of a bad outcome for the borrower. The second part traces the disproportionate effects of providing loans for essential goods and services: The populations that tend to need to borrow most have also been victims of discriminatory and exclusionary treatment in the past. The third part examines why, despite debt’s negative effects, lawmakers have chosen to subsidize credit rather than to allocate funds without attaching a repayment obligation (i.e., by providing free higher education or free healthcare). The fourth part briefly notes how using debt to finance healthcare, higher education, and daily necessities has knock-on effects for borrowers, subjecting them to legal and statutory frameworks—like those governing debt collection and credit reporting—that would be irrelevant were debt not involved.
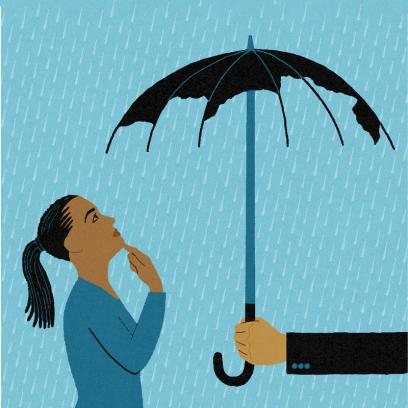
1. The Trouble with Debt
“I have been teaching since 2007, but with my child’s medical costs—which are high because of special needs—and high energy costs, we had to be late on energy bills. Our power was disconnected before Christmas.”
–Matthew, an AFT member from Texas
The problem with borrowing to pay for essential needs like healthcare and education is straightforward: Debt increases a borrower’s risk. Further, there is no secondary market that the borrower could use to unload an unsuccessful investment: Someone forced into medical debt cannot resell their health to somebody else and may find repayment difficult or impossible, even though a healthier person may more easily find employment. Similarly, the person who borrows to pay for education cannot resell the education to someone else even though a person with more education may command a wage premium and, due to economic conditions beyond any one person’s control, may be unable to get a job paying enough to enable repayment of loans. And the same repayment risk confronts the consumer who uses debt to pay for retail necessities, like clothes or food, even though these goods could be resold—after all, resale would mean that the buyer would not have items necessary to live. This feature of such basic goods makes debt financing particularly unhelpful.
For some, debt also discourages purchases in the first place because people rationally do not want to take on the burden and risk of repayment. Determining how many people change their behavior this way is difficult because measuring the effect would require figuring out which people chose not to do something and then surveying them to find out why they did not do it. Nevertheless, there is evidence that members of some groups, like recent immigrants, are more likely to resist taking on debt.6
Importantly, debt aversion can undermine class mobility. Relative to someone who does not need a loan, anyone who borrows gets less of a benefit from whatever they invest in because of the obligation to repay; of course, the more they borrow, the more that repayment burden reduces the value of the investment. On the other hand, those deterred from debt that could enable them to earn higher wages, for example, ensure that they do not get bigger paychecks. There are possible negative effects between these extremes. Consider the case of a student who wants to minimize borrowing to pay for higher education. That student may choose to work while enrolled, earning an income and borrowing less but protecting less time for study and important networking activities and lengthening time to program completion, thereby reducing the potential value of the program of study.7
Extending loans to people who lack the income or wealth to pay for necessary goods or services certainly makes it possible for them to get what they need. That is undeniable. But so too are the consequences of requiring repayment. Only borrowers must worry that they may be unable to meet their obligation due to an event beyond their control. That makes debt financing stressful as well as regressive, in the sense that those who have access to greater wealth or whose families earn higher incomes can avoid the risk and reap the full benefit of whatever they invested in, whether healthcare, education, or raspberries.
Borrowers face an additional, intangible burden that lies outside the scope of my discussion but is worth mentioning: Debt is a moral concept. “Good” people repay their debts; thus, failure to repay a loan is a marker of moral failure. This simplistic morality ignores all the unjust realities that result in some families having more wealth than others, that might force someone to take out a loan, and that might make repayment in full impossible. It also undermines policy arguments in favor of mitigating the harsh effects of debt. If the failure to repay a debt is blameworthy, why should anyone else step in to help? Perhaps most problematic, such questionable morality gets in the way of considering other policy responses—like healthcare for all and tuition-free public colleges—that would eliminate the need to borrow.

2. How Debt Reinforces Inequality
“ ‘Robbing Peter to pay Paul’ is how I finagle monthly bills. There’s always something being put aside in order to continue trudging through. Nothing is comfortable. I’m barely hanging on by my fingernails every single month. When you are barely scraping by, saving for retirement is a luxury. Even when we find ourselves with a little financial padding, it’s gone almost immediately because of an unforeseen circumstance. It’s frustrating. It’s depressing. This is not the way it’s supposed to be.”
–Jessica, an AFT member from Minnesota
Members of some groups are far more likely to need to borrow to make purchases than members of other groups. This is the result of differences in income and wealth, which reflect differing levels of education, differing opportunities in the past and present, and disparities in wages, among other factors. These characteristics correlate consistently with race: Black and Latine people earn less than white and Asian people. The median white household earns over 60 percent more annually than the median Black household, and the median Black household earns less than any other racial group.8
People with less education earn less than people with more education; the premium associated with an undergraduate degree has proven resilient, even as the wage gap between high school and college graduates has narrowed. In 2024, the median earnings of a household headed by someone with at least a college degree slightly exceeded $132,000, while the median income earned by a household headed by a high school graduate was less than half that amount.9 Patterns in educational achievement exhibit racial disparities, in that Black and Latine people are less likely to pursue higher education,10 less likely to complete if they do pursue,11 and more likely to struggle with repayment.12 None of this is new—but in an environment characterized by rising prices, differences in earnings contribute to differences in the opportunities people can afford to pursue.
Differences in income over time translate into differences in wealth, which track aspects of identity, too. White and Asian families have considerably more wealth than Black and Latine families. These wealth differences reflect not only current disparities in earnings but also different histories. For example, for many decades, Black and Latine families had fewer opportunities to purchase housing,13 which for most families is the single biggest asset. When Black and Latine families could purchase housing, they were restricted to neighborhoods with lower home values. Redlining by banks and explicitly racist government policies created these disparities.* In the absence of broad efforts to provide compensation along lines of race, the resulting wealth gaps have persisted. According to one recent study, in 2022 the median net worth (i.e., the difference between assets and liabilities) of white families approached $300,000 each and that of Asian families exceeded $500,000; in contrast, the median net worth of Black families was less than $50,000 and that of Hispanic families was slightly more than $60,000.14
There are other meaningful differences in wealth and income that contribute to greater or lesser reliance on borrowing. For example, people born in the United States earn more than people born elsewhere.15 Households consisting of married couples have higher earnings than households with other family structures.16 Women earn less than men,17 and not surprisingly, women in general have fewer assets and a correspondingly lower net worth than men.18 (This disparity persists despite the fact that more women than men pursue and complete higher education,19 which correlates with earning a higher income generally.20)
Given these differences in wealth and income, it should come as no surprise that debt burdens vary along the same dimensions: People who earn lower incomes and those who have less wealth are more likely to have to borrow. Data on debt illustrate these patterns, although often indirectly; data on consumer debt do not consistently include borrowers’ demographic characteristics, like race. But journalists looking into disparities have found that Black and Latine households are likely to exhibit worse—that is, higher—debt-to-income ratios, making repayment of loans a greater financial strain.21
People living in greater financial precarity are more likely to take advantage of “buy now, pay later” (BNPL) purchasing options, which impose no interest costs or fees on consumers who make their payments on time. Not surprisingly, people who use BNPL tend to have less cash in their bank accounts and are more likely to be Black, Latine, and/or female. They are also more likely to have filed for bankruptcy protection and to have lower credit scores.22 Again, the pattern is consistent: People who have fewer financial assets are more likely to borrow, and disproportionately, those with fewer financial assets belong to groups that government and private sector policy historically excluded or treated on worse terms.
Finally, the implications of the disparities outlined above are evident in data on loan delinquency (i.e., when a borrower is late on required payments and at greater risk of default). Delinquency rates across racial and ethnic groups show that Black and Latine borrowers are more likely to be behind on credit card payments, even though their balances are lower on average.23
These disparities in wealth, income, borrowing, and borrowing outcomes along lines of race, sex, education level, and other aspects of identity provide context for policy discussions about how people take on and manage debt. Promoting greater equality of opportunity entails making policy choices that (1) recognize how typical members of different groups, however defined, confront starkly different financial options, and (2) consider how pursuit of the same goods, services, and experiences can impose far greater costs and risk on those who historically have earned lower incomes and had less access to wealth. Simply put, the need to draw on credit is an indicator of inequality. While borrowing puts purchases in reach, debt alone does not erase gaps in wealth and income.
This reliance on debt to enable opportunity is not accidental. It is the result of policy decisions to reduce expenditures that address economic inequality. For example, federal Pell Grants for students with greater financial need have not kept up with the cost of higher education.24 This has meant that in the years since the civil rights and women’s rights movements opened public colleges and universities to Black students and women, lawmakers have funded higher education less generously. And that means that it has become less accessible overall, with disproportionate effects on members of those historically excluded groups. Using debt as a policy tool contributes to the maintenance of hierarchies along lines of race, sex, and class.
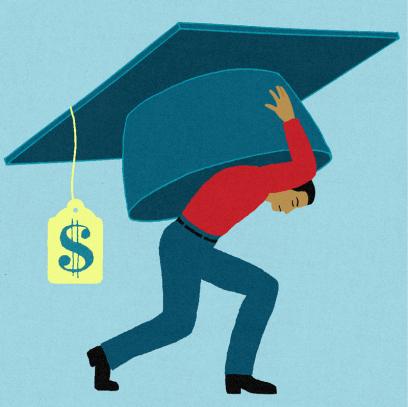
3. Debt for Some, Benefits for All
Higher education and healthcare offer two compelling examples of the unfair hardships imposed by debt. They are welfare goods—goods and services that are essential for the nation collectively and for each of us as individuals—that governments in other advanced economies fund. Why? Because making higher education and healthcare accessible and affordable benefits all of us.
In other wealthy countries, government policies put both within reach of everyone, even those who lack financial resources to pay. In the United States, government provides less direct support, but we can borrow and, in the case of higher education, the biggest lender is the government itself. Yet in clear tension with the underlying policy goals of promoting education and health, debt deters and punishes those who take advantage of resources to pursue either. Below, I explain how.
Student Debt
“Trying to pay off my student loan debt is a nightmare because I can barely afford housing bills.”
–Ashlei, an AFT member from California
Federal student loans enable opportunity, a laudable government objective since higher education promotes health, civic engagement, higher incomes, and even happiness.25 At the same time and perversely, student debt inevitably contributes to the preservation of socioeconomic inequality. Consider a few hard facts: Only those who need to borrow will take out these loans in the first place, so only those who started their higher education with fewer resources confront repayment. For those who graduate, the financial benefit of their education is diminished by the amount of their monthly loan payments. For those who do not graduate and consequently do not get the income boost associated with a degree, repayment is that much more challenging.
Researchers have found that student borrowers with relatively low balances are more likely to struggle in repayment and more likely to default: More than half of those who default owe less than $10,000.26 This is an indicator that the difficulty of repayment is less related to the amount of the debt than to other factors, like degree completion, the nature of the institution (such as for-profit or nonprofit), and field of study.
Students who attend for-profit institutions, for example, tend to borrow larger amounts, are less likely to complete a course of study, and are more likely to struggle with repayment than their counterparts at public institutions and private nonprofit ones.27 Consequently, their likelihood of default is higher. Disproportionately, those enrolling at higher-risk institutions are those least able to manage a poor outcome, such as failure to complete, failure to obtain a job that pays enough to cover the debt obligation, or both (and the former increases the likelihood of the latter). This population includes more students who are the first in their families to pursue higher education and so have less access to information about which education providers are lower or higher risk.28 There is also evidence that this population tends to include more students from marginalized groups29 that historically have been excluded from and underrepresented in higher education generally. Scholars and advocates have found evidence that for-profit institutions actively target these groups.30
Some scholars and politicians argue that federal education loans are too readily available to students and that the amounts and terms of loans should be more restrictive to protect students from taking on debt burdens that they cannot repay.31 Legislation enacted by the Republican-controlled Congress in July 2025 reflects this notion, imposing new limits on maximum amounts for federal loans,32 for example. The problem is that limiting the amount that students can borrow from the federal Department of Education does not mean that students will forgo debt to pay for higher education; it simply means that they will have to borrow from a different lender, most likely on worse terms. And some students, by definition those who cannot pay the cost without borrowing, will abandon their pursuit of higher education entirely. Thus, federal policy at once enables higher education, deters students from pursuing it, and punishes those who need loans—a combination of actions suggesting that debt is not the best tool if the goal really is to promote access to higher education.
Medical Debt
“I’m used to caring for patients who are worried about their health. But more and more lately, there’s something else hanging over them: bills they know they can’t pay. The hospital is suing thousands of patients. It’s embarrassing to walk into hospital rooms knowing the same place providing care is also taking sick people to court. People hear about this and think twice about coming in. That delay isn’t harmless. It makes people sicker.”
–Tina,† an AFT member from Ohio
A 2024 study found that about 20 million people owe medical debt; for 14 million of them, the balance exceeds $1,000.33 Medical debt constitutes nearly one-fourth of all debt in collection and is the form of debt most commonly reported as in collection.34 A 2022 report found that consumers collectively owed $88 billion in medical debt.35 Other studies have higher estimates.36 Unlike federal student loans, which are easy to measure, medical debt can be slippery: In addition to encompassing debts owed to hospitals and other medical service providers, consumers may use credit cards (or other credit products) to pay off medical debts, which moves debt around and obscures its origin but does not address the core challenge of repayment.37
Medical debt reflects the gap between the price imposed for care and the combination of what people can afford to pay (including with insurance) and what the government will subsidize. Viewed this way, medical debt is a policy choice—just like the terms of federal student loans. And just like education, health is both a private and public good in that it benefits individuals and the wider community. The greater the cost burden allocated to individual consumers (instead of the government), the greater the likelihood that the availability of healthcare will vary with wealth and income and thus help maintain socioeconomic inequality. Because socioeconomic inequality reflects historical patterns of exclusion and subordination (such as the exclusion of members of particular groups from educational, employment, and home-buying opportunities), placing health costs on individuals and families disproportionately burdens members of those marginalized groups, including Black and Latine people.38
Different mechanisms that reinforce socioeconomic hierarchies also reinforce each other. Consider: Residential housing patterns reflect discriminatory lending and other policies, as noted above, and it turns out that members of disfavored groups tend to live in places marked by worse health and decreased life expectancy.39 Worse health entails greater healthcare need; at the same time, fewer opportunities to accumulate wealth for members of these groups mean fewer resources to pay the cost. The combination means a greater likelihood of need to borrow for medical care and greater likelihood of difficulty in repayment. It should not be surprising that while fewer than one in four white adults have past-due medical debt, according to one study, nearly one in three Black adults do.40
Like federal student loans, medical debt has pernicious effects, such as deterring some who need healthcare from seeking it41 and incentivizing the cheapest, rather than the most effective, treatments as a means of avoiding debt.42 Like other forms of debt, medical debt weighs on those who owe it, contributing to anxiety and stress that may in turn contribute to health issues that require treatment. The same 2025 Republican legislation that imposed new limits on student loans also imposed cuts on Medicaid and Medicare and failed to extend subsidies for those purchasing healthcare insurance via the Affordable Care Act marketplaces.43 As a result, people who in the past have gotten some federal financial support to obtain healthcare will need to fund it some other way.
Financial Precarity
“When my student loans went into repayment, I plunged into poverty. I borrowed $80,819.58. It’s been 20 years since I graduated from college, and now, despite making regular payments, I owe more than $100,000. I was unable to buy a house except for the luck of circumstance. I certainly couldn’t afford to have a child.”
–Mary Elizabeth, an AFT member from New York‡
While recent legislation is making the situation worse, reliance on debt for higher education and for healthcare is a longstanding problem and represents political failures. The Republican Party has made resistance to fully funding higher education and healthcare into a partisan commitment, tirelessly criticizing and undermining efforts by the Biden administration to address student debt44 and battling against (and in some states refusing to permit) federal efforts to make health insurance more widely available.45
To a degree, legislative battles over providing such important goods as education and healthcare constitute bickering for the sake of partisan advantage. More importantly, this fundamental disagreement between Republicans and Democrats about the role of the government in our lives undermines progress in reducing socioeconomic inequality. In recent decades, most Republican lawmakers have espoused with ever greater determination their commitment to free market principles and their opposition to state support. The rationales offered are not new; a durable claim is that “handouts” create incentives toward sloth and indigence. Empirical realities have less and less of a role in these policy discussions. Barring a crisis that claims far more people as victims, it seems unlikely that either party will pursue the broad reforms needed to abandon debt-driven policies. If one party does, the other will likely try to undo it as soon as control of the legislature changes hands.
This political reality means that borrowing will remain a feature of personal financing of higher education, healthcare, and more for the foreseeable future. And that means the laws governing credit extension and debt collection will affect the provision of such goods and services. Let’s examine the implications.

4. The Complexity of Debt
“My debt is slowly killing me. It seems like no matter how hard I try, I can’t get ahead. I have a couple of medical procedures that I have put off indefinitely because I can’t afford the copays to get them done. My debt has cost me everything—my health, my happiness, relationships, you name it.”
–Rebecca, an AFT member from New Mexico
Debt financing of welfare goods like education and healthcare creates multiple challenges. First, of course, borrowers must repay their loans. Second, borrowers who can’t consistently make timely payments may become subject to debt collection, which can be invasive, pervasive, and difficult to stop. Third, once a debt is incurred, the borrower’s payment track record becomes a reportable fact shared with credit bureaus, which monitor consumer borrowing behavior and share that information with other lenders, as well as employers,46 landlords,47 and others with the power to give or deny opportunities.
Monitoring of repayment behavior means that borrowers who fall behind on loan payments or fail to pay off a loan may be marked as relatively poor credit risks, and that means that future lenders may shun those borrowers or charge them higher interest rates. Either way, reporting on borrower repayment behavior can undermine future life investments that depend on credit, like buying a car or home. Further, because some employers and landlords consult applicants’ credit records, a checkered repayment history can interfere with fundamental life activities like finding a job and renting an apartment. Taking out a loan thus exposes the borrower to a web of risks that are not obvious at the time the debt obligation is created.
Debt collection and credit reporting are both limited by federal and state laws and regulations as well as by industry policies. The federal Fair Debt Collection Practices Act (FDCPA) imposes limits on the tactics that third-party debt collectors can use to try to squeeze funds out of borrowers. For example, the FDCPA prohibits debt collectors from contacting consumers at odd hours and allows consumers to tell a debt collector to cease communicating with them, among other constraints.48 The law also prohibits debt collectors from contacting an employer,49 making threats,50 or making any “false, deceptive, or misleading statement” about the debt as part of the effort to get a consumer to repay.51 Some states, like California and New York,52 have additional rules about debt collection tactics.
The federal Fair Credit Reporting Act sets limits on the length of time a consumer’s credit history may cover (usually seven years) for purposes of informing parties in a transaction involving less than $150,000,53 specifies how credit bureaus are to respond to reports of identity theft,54 and allows consumers to dispute credit records.55 An effort by the federal Consumer Financial Protection Bureau to implement a rule requiring exclusion of medical debt in credit reports was delayed by litigation and then effectively abandoned by the second Trump administration56 (showing another way that the priorities of the Republican executive branch have undermined consumer protection).
Some states have analogous provisions and go further than federal law by prohibiting reporting certain kinds of debt to credit bureaus. For instance, California law also prohibits including medical debt on credit reports,57 limits late fees collected on student loans, and requires servicing companies that manage loans on behalf of the US Department of Education to respond in a timely fashion to inquiries from student borrowers.58
Needless to say, the protections afforded by state and federal laws may not deter unlawful collection efforts if borrowers do not know about them or if the likelihood of any penalties is low. That reality highlights the broader challenge posed by consumer reliance on debt to finance welfare goods: the burden of complexity. Not only do borrowers confront difficult decisions about higher education and healthcare that are inevitably fraught and nuanced, but they also confront the terms of loans, the laws and regulations that affect those terms, the tactics debt collectors may use to seek repayment, and the nature of repayment monitoring. And as with debt itself, the impact is selective: Only those with fewer resources and likely less time, who are also disproportionately people who belong to relatively disadvantaged groups in the first place, must navigate these debt and repayment landscapes.
There is nothing inevitable about debt. The essential goods and services used as examples above could be paid for some other way, such as through provision of basic income grants, larger education tuition grants, or publicly funded healthcare. But in the United States, we put a greater—and an increasing—share of the cost of welfare goods on individual people rather than the collective national or state community. While this decision reflects the values and beliefs of the legislators currently in control of Congress and many states, those values and beliefs can change. So can the legislators. Other countries have made different decisions about the allocation of those costs, and their people do not exhibit the same degree of indebtedness for life essentials like healthcare and education.59 In the United States, the ability to borrow enables people with fewer financial resources to access healthcare and education but burdens them with repayment obligations and subjects them to a web of complex regulations governing collections and credit reporting. Rather than equalizing opportunity, debt provides opportunity with strings attached, holding borrowers—and our nation—down.
Jonathan D. Glater is a professor at the University of California, Berkeley, School of Law, where he is a faculty codirector of the Center for Consumer Law and Economic Justice. He is a cofounder and codirector of the Student Loan Law Initiative of the University of California.
*To read about redlining and its ongoing impacts, see “Suppressed History: The Intentional Segregation of America’s Cities” in the Spring 2021 issue of American Educator. (return to article)
†This is a pseudonym. (return to article)
‡To read more of Mary Elizabeth’s story, see “Life Below Water.” (return to article)
Endnotes
1. K. Severson, “Where Might the Iran War Hit Your Grocery Bill? Start with Raspberries,” New York Times, March 27, 2026, nytimes.com/2026/03/27/dining/raspberry-prices.html?searchResultPosition=1.
2. K. Rhone, “‘It’s Just Crazy’: High Car Payments Make Ownership Feel Impossible,” New York Times, March 16, 2026, nytimes.com/2026/03/16/business/car-ownership-prices-interest-rates.html.
3. US Bureau of Labor Statistics, “Consumer Price Index,” www.bls.gov/cpi.
4. P. Andrade et al., “Is Post-Pandemic Wage Growth Fueling Inflation?,” Federal Research Bank of Boston, January 16, 2024, bostonfed.org/publications/current-policy-perspectives/2024/is-post-pandemic-wage-growth-fueling-inflation.aspx.
5. S. Wolla, “When the Unexpected Happens, Be Ready with an Emergency Fund,” Federal Reserve Bank of St. Louis, September 2, 2025, stlouisfed.org/publications/page-one-economics/2025/sep/when-unexpected-happens-be-ready-with-emergency-fund.
6. See, for example, A. Cunningham and D. Santiago, Student Aversion to Borrowing: Who Borrows and Who Doesn’t (Institute for Higher Education Policy and Excelencia in Education, December 2008), files.eric.ed.gov/fulltext/ED503684.pdf; and P. Burdman, “The Student Debt Dilemma: Debt Aversion as a Barrier to College Access,” Center for Studies in Higher Education, UC Berkeley, October 2, 2005, cshe.berkeley.edu/publications/student-debt-dilemma-debt-aversion-barrier-college-access; see also M. Long, “The Relationship Between Debt Aversion and College Enrollment by Gender, Race, and Ethnicity: A Propensity Scoring Approach,” Studies in Higher Education 47, no. 9 (2022): 1808–26.
7. Laura W. Perna and Taylor K. Odle, “Recognizing the Reality of Working College Students,” Academe 106:1 (Winter 2020): 18-22, aaup.org/academe/issues/106-2/recognizing-reality-working-college-students
8. US Census Bureau, “Figure 2. Real Median Household Income by Race and Hispanic Origin: 1967 to 2024,” 2025, census.gov/content/dam/Census/library/visualizations/2025/demo/p60-286/figure2.pdf.
9. US Census Bureau, “Figure 1. Median Household Income and Percent Change by Selected Characteristics,” 2025, census.gov/content/dam/Census/library/visualizations/2025/demo/p60-286/figure1.pdf.
10. National Center for Education Statistics, “Table 302.20. Percentage of Recent High School Completers Enrolled in College, by Race/Ethnicity and Level of Institution: 1960 Through 2023,” Digest of Education Statistics, US Department of Education, nces.ed.gov/programs/digest/d24/tables/dt24_302.20.asp?current=yes.
11. National Center for Education Statistics, “Table 326.10. Graduation Rate from First Institution Attended for First-Time, Full-Time Bachelor’s Degree-Seeking Students at 4-Year Postsecondary Institutions, by Race/Ethnicity, Time to Completion, Sex, Control of Institution, and Percentage of Applications Accepted: Selected Cohort Entry Years, 1996 Through 2017,” US Department of Education, nces.ed.gov/programs/digest/d24/tables/dt24_326.10.asp?current=yes.
12. U. Neelakantan, “Black-White Differences in Student Loan Default Rates Among College Graduates,” Federal Reserve Bank of Richmond, April 2023, richmondfed.org/publications/research/economic_brief/2023/eb_23-12; see also I. Levine et al., The Student Loan Default Divide: Racial Inequities Play a Role (Pew Charitable Trusts, December 2024), pew.org/en/research-and-analysis/reports/2024/12/the-student-loan-default-divide-racial-inequities-play-a-role.
13. M. Gerken et al., “Assessing the Legacies of Historical Redlining: Correlations with Measures of Modern Housing Instability,” Urban Institute, January 2023, urban.org/sites/default/files/2023-01/Addressing%20the%20Legacies%20of%20Historical%20Redlining.pdf.
14. A. Aladangady et al., “Greater Wealth, Greater Uncertainty: Changes in Racial Inequality in the Survey of Consumer Finances,” FEDS Notes, Board of Governors of the Federal Reserve System, October 18, 2023, federalreserve.gov/econres/notes/feds-notes/greater-wealth-greater-uncertainty-changes-in-racial-inequality-in-the-survey-of-consumer-finances-20231018.html?wpisrc=nl_powerup.
15. US Bureau of Labor Statistics, “Economic News Release: Labor Force Characteristics of Foreign-Born Workers Summary,” May 19, 2026, www.bls.gov/news.release/forbrn.nr0.htm.
16. M. Kollar and Z. Scherer, “Figure 1. Median Household Income and Percent Change by Selected Characteristics,” in Income in the United States: 2024: Current Population Reports (US Census Bureau, US Department of Commerce, September 2025), census.gov/library/publications/2025/demo/p60-286.html.
17. US Bureau of Labor Statistics, “Women’s Earnings Were 83.6 Percent of Men’s in 2023,” TED: The Economics Daily, March 12, 2024, www.bls.gov/opub/ted/2024/womens-earnings-were-83-6-percent-of-mens-in-2023.htm.
18. A. Lee, “The Gender Wealth Gap in the United States: Trends and Explanations,” Social Science Research 107 (September 2022): 102745.
19. For example, far more women receive bachelor’s degrees than do men. National Center for Education Statistics, “Table 322.20. Number and Percentage Distribution of Bachelor’s Degrees Conferred by Postsecondary Institutions, by Race/Ethnicity and Sex of Student: Selected Academic Years, 1976–77 Through 2022–23,” US Department of Education, Digest of Education Statistics, nces.ed.gov/programs/digest/d24/tables/dt24_322.20.asp?current=yes. The same is true of master’s degrees. National Center for Education Statistics, “Table 323.20. Number and Percentage Distribution of Master’s Degrees Conferred by Postsecondary Institutions, by Race/Ethnicity and Sex of Student: Selected Academic Years, 1976–77 Through 2022–23,” US Department of Education, Digest of Education Statistics, nces.ed.gov/programs/digest/d24/tables/dt24_323.20.asp?current=yes. And it holds for doctorates. National Center for Education Statistics, “Table 324.20. Number and Percentage Distribution of Doctor’s Degrees Conferred by Postsecondary Institutions, by Race/Ethnicity and Sex of Student: Selected Academic Years, 1976–77 Through 2022–23,” US Department of Education, Digest of Education Statistics, nces.ed.gov/programs/digest/d24/tables/dt24_324.20.asp?current=yes.
20. US Bureau of Labor Statistics, “More Education: Lower Unemployment, Higher Earnings,” www.bls.gov/emp/education-pays-handout.pdf.
21. C. Weller, “Households of Color Owe Costlier, Riskier Debt, Hurting Their Chances to Build Wealth,” Forbes, December 28, 2021, forbes.com/sites/christianweller/2021/12/28/households-of-color-owe-costlier-riskier-debt-hurting-their-chances-to-build-wealth.
22. J. Stavins, “Buy Now, Pay Later: Who Uses It and Why,” Federal Reserve Bank of Boston, May 23, 2024, bostonfed.org/publications/current-policy-perspectives/2024/buy-now-pay-later-who-uses-it-why.aspx.
23. R. Avtar, R. Chakrabarti, and K. Chatterji-Len, “Unequal Distribution of Delinquencies by Gender, Race, and Education,” Liberty Street Economics (blog), Federal Reserve Bank of New York, November 17, 2021, libertystreeteconomics.newyorkfed.org/2021/11/unequal-distribution-of-delinquencies-by-gender-race-and-education. The same pattern is evident in auto loan repayment data, home mortgage repayment data, and student loan repayment data.
24. C. Dortch, Federal Pell Grant Program of the Higher Education Act: Primer (Congressional Research Service, November 6, 2024), https://www.congress.gov/crs-product/R45418.
25. W. McMahon, Higher Learning, Greater Good (Johns Hopkins University Press, 2017); see also W. McMahon, “The External Social Benefits of Higher Education: Theory, Evidence, and Policy Implications,” Journal of Education Finance 46, no. 4 (Spring 2021): 398–430.
26. A. Looney and C. Yannelis, “How Useful Are Default Rates? Borrowers with Large Balances and Student Loan Repayment,” Economics of Education Review 71 (2019): 135–45. Another study found that borrowers who owe less than $5,000 are more likely to default on their student loans. K. Blagg, Underwater on Student Debt: Understanding Consumer Credit and Student Loan Default (Urban Institute, August 2018), urban.org/sites/default/files/publication/98884/underwater_on_student_debt_0.pdf. See also M. Brown et al., “Looking at Student Loan Defaults Through a Larger Window,” Liberty Street Economics (blog), Federal Reserve Bank of New York, February 19, 2015, libertystreeteconomics.newyorkfed.org/2015/02/looking_at_student_loan_defaults_through_a_larger_window.
27. A. Looney and C. Yannelis, A Crisis in Student Loans? How Changes in the Characteristics of Borrowers and in the Institutions They Attended Contributed to Rising Loan Defaults (Brookings, 2015), brookings.edu/articles/a-crisis-in-student-loans-how-changes-in-the-characteristics-of-borrowers-and-in-the-institutions-they-attended-contributed-to-rising-loan-defaults; and L. Armona, R. Chakrabarti, and M. Lovenheim, Student Debt and Default: The Role of For-Profit Colleges (Federal Reserve Bank of New York, April 2017), newyorkfed.org/research/staff_reports/sr811.html.
28. Looney and Yannelis, A Crisis in Student Loans?; and Armona, Chakrabarti, and Lovenheim, Student Debt and Default.
29. Looney and Yannelis, A Crisis in Student Loans?; and Armona, Chakrabarti, and Lovenheim, Student Debt and Default.
30. T. Merrill et al., “For-Profit Schools’ Predatory Practices and Students of Color: A Mission to Enroll Rather Than Educate,” Harvard Law Review (blog), July 30, 2018, harvardlawreview.org/blog/2018/07/for-profit-schools-predatory-practices-and-students-of-color-a-mission-to-enroll-rather-than-educate.
31. This argument dates back decades. The secretary of education under President Ronald Reagan, William J. Bennett, famously made it in a New York Times op-ed nearly 40 years ago: William J. Bennett, “Our Greedy Colleges,” N.Y. Times (Feb. 18, 1987), at A31, nytimes.com/1987/02/18/opinion/our-greedy-colleges.html
32. A. Hegji, “Student Loan Types and Limits in the FY2025 Budget Reconciliation Act,” Congressional Research Service, July 10, 2025, www.congress.gov/crs_external_products/IN/PDF/IN12585/IN12585.1.pdf.
33. S. Rakshit et al., “The Burden of Medical Debt in the United States,” Peterson-KFF Health System Tracker, February 12, 2024, www.healthsystemtracker.org/brief/the-burden-of-medical-debt-in-the-united-states.
34. K. Schneider, “An Overview of Medical Debt: Collection, Credit Reporting, and Related Policy Issues,” Congressional Research Service, August 29, 2025, congress.gov/crs_external_products/IF/PDF/IF12169/IF12169.7.pdf.
35. Consumer Financial Protection Bureau, Medical Debt Burden in the United States (February 2022), files.consumerfinance.gov/f/documents/cfpb_medical-debt-burden-in-the-united-states_report_2022-03.pdf.
36. For example, two 2021 studies reported a total of $140 billion and $220 billion in unpaid medical debt in the United States. R. Kluender et al., “Medical Debt in the US, 2009–2020,” JAMA 326, no. 3 (July 2021): 250–56; and Rakshit et al., “The Burden of Medical Debt.”
37. S. Nuñez, “The US Medical Debt Crisis: Catastrophic Costs of Insufficient Health Coverage,” Roosevelt Institute, May 15, 2025, rooseveltinstitute.org/publications/medical-debt.
38. A. Aborode et al., “Healthcare Debts in the United States: A Silent Fight,” Annals of Medicine & Surgery 87, no. 2 (January 21, 2025): 663–72.
39. M. Santillo et al., “Communities of Color Disproportionally Suffer from Medical Debt,” Urban Institute, October 14, 2022, urban.org/urban-wire/communities-color-disproportionally-suffer-medical-debt.
40. B. Haynes, The Racial Health and Wealth Gap: Impact of Medical Debt on Black Families (National Consumer Law Center, March 2022), nclc.org/wp-content/uploads/2022/09/RacialHealth-Rpt-2022.pdf.
41. National Center for Health Statistics. Percentage of adults aged 18 and over who did not get needed medical care due to cost in the past 12 months, United States, 2019—2024. National Health Interview Survey, cdc.gov/nchs/data/nhis/earlyrelease/earlyrelease202506.pdf.
42. A. Carroll, “Even a Modest Co-Payment Can Cause People to Skip Drug Doses,” New York Times, November 11, 2019, nytimes.com/2019/11/11/upshot/drugs-cost-diabetes.html; and Bernard, Selden, and Fang, “The Joint Distribution.”
43. G. Lopez, “A ‘Big, Beautiful Bill,’” New York Times, May 15, 2025, nytimes.com/2025/05/15/briefing/a-big-beautiful-bill.html; Center on Budget and Policy Priorities, “By the Numbers: Harmful Republican Megabill Will Take Health Coverage Away from Millions of People and Raise Families’ Costs,” August 27, 2025, cbpp.org/research/health/by-the-numbers-harmful-republican-megabill-will-take-health-coverage-away-from; and A. Rosen, “How New Federal Legislation Will Affect Health Care Costs and Access for Americans,” Johns Hopkins Bloomberg School of Public Health, July 30, 2025, publichealth.jhu.edu/2025/the-changes-coming-to-the-aca-medicaid-and-medicare.
44. M. Shear, “Republican-Led States Sue to Block Biden’s Plan to Erase Student Loan Debt,” New York Times, September 29, 2022, nytimes.com/2022/09/29/us/politics/suit-biden-student-loan-debt.html; and K. Knott, “Is More Debt Relief Imminent? A New Lawsuit Says Yes—and Aims to Stop It,” Inside Higher Ed, September 5, 2024, insidehighered.com/news/government/student-aid-policy/2024/09/05/gop-states-pre-emptively-sue-block-new-debt-relief.
45. S. Gringlas, “Red States That Have Resisted Medicaid Expansion Are Feeling Pressure to Give Up,” National Public Radio, February 21, 2024, npr.org/2024/02/21/1232859171/red-states-that-have-resisted-medicaid-expansion-are-feeling-pressure-to-give-up.
46. Consumer Financial Protection Bureau, “When I Apply for a Job, What Do Employers See When They Do a Credit Check for Employment and a Background Check?,” December 31, 2024, consumerfinance.gov/ask-cfpb/when-i-apply-for-a-job-what-do-employers-see-when-they-do-a-credit-check-for-employment-and-a-background-check-en-1823.
47. Consumer Financial Protection Bureau, “Review Your Rental Background Check,” January 30, 2024, consumerfinance.gov/rules-policy/tenant-background-checks/review-your-rental-background-check.
48. Communication in Connection with Debt Collection, 15 US Code §1692c (1977).
49. Communication in Connection with Debt Collection, 15 US Code §1692c (1977).
50. Harassment or Abuse, 15 US Code §1692d (1977).
51. False or Misleading Representations, 15 US Code §1692e (1977).
52. Consumers in California benefit from the Rosenthal Fair Debt Collection Practices Act, California Civil Code §1788; those in New York, from that state’s Consumer Credit Fairness Act, New York State Senate Bill S153 (2021).
53. Requirements Relating to Information Contained in Consumer Reports, 15 US Code §1681c (1970).
54. Identity Theft Prevention; Fraud Alerts and Active Duty Alerts, 15 US Code §1681c-1 (2010).
55. Procedure in Case of Disputed Accuracy, 15 US Code §1681i (2010).
56. Schneider, “An Overview of Medical Debt.”
57. California Civil Code §1785.13.
58. California Civil Code §1788.102.
59. M. Prasad, The Land of Too Much: American Abundance and the Paradox of Poverty (Harvard University Press, 2012).
[Illustrations by James Steinberg]